Research Article | | Peer-Reviewed

Genetic Diversity Studies in Durum Wheat (Triticum turgidum L. var. durum) Advanced Lines Based on Cluster and Principal Component Analysis Using Agronomic Traits in Northwestern Ethiopia

Received: 14 January 2025     Accepted: 16 May 2025     Published: 20 June 2025
Views:       Downloads:
Abstract

Durum wheat (Triticum turgidum L. var. durum) production and productivity in Ethiopia is low as compared to the world average productivity because of limited breeding and pre breeding interventions. Cluster analysis and principal component analysis are valuable tools for identifying and improving plant traits in durum wheat genotypes. This study, conducted at the Ethiopian Institute of Agricultural Research's Pawe Agricultural Research Center, Injibara substation, aimed to assess the clustering patterns of durum wheat genotypes and pinpoint key traits that differentiate these genotypes. A total of 45 durum wheat genotypes were examined using a 5x9 alpha lattice design during the 2020/2021 cropping season. Results from the analysis of variance underscored significant variations (P ≤ 0.01) among genotypes for all traits studied. Cluster analysis revealed the classification of the 45 durum wheat genotypes into six distinct clusters. Genotypes in Cluster IV exhibit significant genetic diversity, making them valuable candidates for direct integration into hybridization programs aimed at cultivating high-yielding durum wheat varieties. On the other hand, genotypes in cluster I showcase distinct genetic variations in protein content, suggesting their potential use in augmenting protein and gluten levels as well as other favorable attributes beyond grain yield in breeding initiatives, while Principal Component Analysis (PCA) identified five principal components with Eigen values above one, jointly elucidating 79.41% of the total variation. The findings suggest promising prospects for enhancing yield and desirable characteristics through selective breeding. Nonetheless, given the study's single-season scope, further evaluations across diverse locations and over multiple cropping seasons are imperative to validate and build upon these initial insights.

Published in International Journal of Photochemistry and Photobiology (Volume 7, Issue 1)
DOI 10.11648/j.ijpp.20250701.13
Page(s) 19-28
Creative Commons

This is an Open Access article, distributed under the terms of the Creative Commons Attribution 4.0 International License (http://creativecommons.org/licenses/by/4.0/), which permits unrestricted use, distribution and reproduction in any medium or format, provided the original work is properly cited.

Copyright

Copyright © The Author(s), 2025. Published by Science Publishing Group

Keywords

Durum Wheat, Genotype, Genetic Distance, Principal Component Analysis, Genetic Variability

1. Introduction
Durum wheat (Triticum turgidum L. var. durum) is a monocotyledonous plant of the Gramineae family and of the Triticeae tribe and belongs to the genus Triticum. Durum wheat is an allo tetraploid (two genomes: AABB) species with a total of 28 chromosomes (2n=4x=28), containing the full diploid set off chromosomes from each of its progenitor species . Durum wheat has a wide genetic diversity that is the most important thing for its diverse important; especially Ethiopia's diverse landraces represent a significant pool of genetic wheat variation . Durum wheat's high protein content and unique gluten properties make it ideal for specialized uses, primarily semolina for pasta. In North Africa, particularly Tunisia, it's also favored for couscous, burgul, macaroni, and traditional breads . Analyzing durum wheat's genetic diversity is crucial for breeding programs. Understanding this diversity helps classify breeding populations and improve efficiency, ultimately leading to increased food production . Modern breeding techniques can create uniform, high-yielding, and stress-resistant plants , but incorporating diverse genetic backgrounds remains vital. Studying diverse traits helps breeders select genotypes with desirable characteristics , using both morphological and molecular markers. Estimating genetic distance is a key for selecting durum wheat genotypes for hybridization, a cornerstone of durum wheat breeding. Genetic divergence between parents is necessary to exploit transgressive segregation and maximize heterosis . Greater genetic distance generally leads to greater hybrid vigor. Various methods, including cluster analysis, principal component analysis, and factor analysis, are used to assess genetic diversity, aiding in parental selection, tracing crop evolution, identifying centers of origin and diversity, and studying environmental interactions . Principal Component Analysis (PCA) is a powerful multivariate technique for grouping data based on the similarity coefficients or variance-covariance of component traits. By extracting the most significant underlying patterns in the data, PCA provides valuable insights into major groups and their distinguishing characteristics. However, when it comes to closely related accessions, a more detailed resolution is required, which can be achieved through cluster analysis. According to Liu et al. , the combined use of both PCA and cluster analysis offers a more nuanced understanding of the importance of different traits in classifying accessions, as posited by . In other words, the joint application of these two analytical methods provides a clearer and more insightful perspective on the relationships among the accessions under study. Various algorithms have been employed to analyze genetic diversity through cluster analysis. Among these methods, such as Un-weighted Pair-Group Average using Arithmetic Mean (UPGMA), Ward’s, SLINK, and CLINK, which have been historically utilized for clustering plant materials and exploring genetic diversity, UPGMA and Ward’s methodologies stand out as the most commonly favored . UPGMA, known as Un-weighted Pair-Group Average using Arithmetic Mean, represents a statistically robust amalgamation principle that aligns well with the familial connections based on genetic relationships. The utilization of Euclidean distance holds significance in estimating genetic distances between parent plants to optimize transgressive segregation, as it quantifies the actual geometric space between genotypes . Euclidean distance, or the straight-line measurement, is a prevalent technique for determining genetic distances and employing tree clustering methods to analyze individual genotypes or populations based on morphological data. In this study, advanced breeding lines were investigated to unearth ancestral relationships and their role in selecting superior durum wheat genotypes for the enhancement of cultivars and Germplasm. The primary goals of this research endeavor were to evaluate the genetic relationships among durum wheat genotypes through their ancestry using cluster analysis and principal component analysis, characterize the genetic diversity of these genotypes using morphological traits, and offer insights into the genetic landscape of durum wheat varieties.
2. Materials and Methods
2.1. Description of the Experimental Site
The experiment was conducted at the Pawe Agricultural Research Center's Injibara substation, situated in a region with a unique combination of geographical and climatic factors. Located at 10° 56' 27-53'' N latitude and 36° 52' 27-55'' E longitude, the substation is 464 km from Addis Ababa and 2489 meters above sea level. The area experiences a moderate climate, with mean annual temperatures ranging from 10.3°C to 22.5°C, and receives approximately 1344 mm of rainfall annually. The soil type is characterized as nitosols, with a moderate to deep depth and a pH value of 5.02.
2.2. Experimental Materials, Experimental Design, Procedures and Trial Management
The experiment utilized forty-five durum wheat genotypes, comprising forty-three genotypes and two standard checks. The study was designed using a 5x9 alpha lattice experimental design with two replications. Each plot consisted of four rows, each 2.5 meters in length, with a row spacing of 0.2 meters, resulting in a total plot area of 2 square meters (0.8 m x 2.5 m). Planting was conducted by hand drilling in August 2020; with a seed rate of 150 kg/ha (30 g per plot). Fertilization followed the recommended rates of 200 kg/ha nitrogen and 100 kg/ha NPS, applied as Urea and DAP at rates of 40 g and 20 g per plot, respectively. The fertilizers were incorporated into the soil during sowing, with Urea applied in two splits: one at planting and the other 1.5 months later. DAP was applied entirely at the time of planting. To address soil acidity, quicklime was applied at planting at a rate of 1255.5 kg/ha (0.25 kg per plot), based on the soil's exchangeable acidity. Weed management was standardized across both replications, with three hand weeding performed on the same days to minimize variations. For data collection, the central two rows of each plot, covering an area of 1 m², were designated for agronomic and grain yield measurements, while the border rows were left intact to prevent border effects. All other agronomic practices were uniformly applied throughout the plots, adhering to the recommended packages for wheat production in the region, ensuring the cultivation of a healthy crop.
2.3. Data Collected
Ten competitive plants per in each replication was randomly selected for recording observations on different characters via, plant height (PH) cm, number of effective tillers per plant (ETNP), number of none effective tiller per plant (NNT), length of spike (SL) cm, number of spikelet per spike (SPS), number of kernel per spike (KPS). For other traits, grain yield per plot (g), biomass yield per plot (g), harvest index (HI) (%) and thousand kernel weight per plot (g), Phenological data like days to 50% heading (DSH) days, grain filling period (GFP) days and days to 75% physiological maturity (DSM) days were taken on plot basis.
2.4. Genetic Divergence Analysis
Genetic dissimilarity matrix estimation and agglomerative hierarchical clustering (AHC) analyses among genotypes were performed using XLSTAT 2014 statistical package . Ward’s minimum variance agglomeration method was used to estimate the Euclidean distance and clustering operations produced a binary clustering tree (dendrogram), whose root was the cluster that contained all the treatments assigned to particular genotypes . An acceptable cluster is defined as a group of two or more genotypes with a within-cluster genetic distance less than the overall mean genetic distance and between cluster distances greater than their within cluster distance of the two clusters involved . The D2 values obtained for pairs of clusters was considered as the calculated values of Chi‐square (x2). D2 values tested for significance at (5%) probability levels against the tabular value of x2 for ‘P’ degree of freedom, where P is the number of parameters considered .
2.5. Principal Component Analysis
Principal Component Analysis (PCA) was used to find out the characters, which accounted more to the total variation. Principal components based on correlation matrix were calculated by using XLSTAT software . Principal components having Eigen values greater than one was considered as significant and presented in the result.
3. Result and Discussion
3.1. Genetic Divergence Analysis
Description of genotype for agronomical useful characters is an important prerequisite for effective and efficient utilization of genotypes in breeding program. Divergence analysis is a technique used to categorize genotypes that are similar into one group and others into different groups. D-square statistics (D2) developed by Euclidian, has been used to classify the divergent genotypes in to different groups. These techniques measures the forces of differentiation at two levels, namely, intra-cluster and inter cluster levels and thus helps in the selection of genetically divergent parents to be ordered in hybridization program.
3.1.1. Estimation of Squared Distance (D2) and Clustering of Genotypes
The distributions of 45 genotypes land in to six divergent clusters and presented in (Table 1 and Figure 1). Genetic divergence analysis based on fourteen characters of 45 durum wheat genotypes resulted in the formation of six distinct clusters comprised of four to ten genotypes. Cluster (III) was accounted for largest amount of genotypes which constituted about ten genotypes (22.22%) followed by cluster (II) and (V) with nine genotypes each (20%), cluster (IV) with eight genotypes (17.8%), cluster (I) with five genotypes (11.11%) and cluster (VI) with four genotypes (8.9%). Similar finding was reported by
3.1.2. Cluster Distance of Durum Wheat Genotypes
The intra and inter Euclidean cluster distances of genotypes presented in (Table 2). The highest inter cluster distance were observed between cluster (IV) and cluster (VI) D2 = 4118.67, followed by cluster (IV) and cluster (I) D2 = 3082.87 and cluster (IV) and cluster (II) D2=2659.77. The shortest inter cluster squared distance was found between cluster (III) and cluster (V) D2 = 153.47. The largest intra cluster distance was obtained from cluster (III) D2=440.93. The shortest intra cluster distance was obtained from cluster (IV) D2=181.46, followed by cluster (I) D2=248.56. This indicates the existence of wider diversity in the present tested genotypes which creates an opportunity for wheat hybridization programs. Similar to the present finding revealed that high genetic diversity in durum wheat genotypes in their study.
It was general observations that cluster (IV) had higher distances from the other clusters indicated that the genotypes in cluster (IV) were distinctly different from the others. Crosses between the landraces and introduced genotypes constituted in different clusters are expected to provide relatively better genetic recombination and segregation in their progenies . Thus, crossing between genotypes in clusters (IV) with cluster (VI) and cluster (I) with cluster (IV) reveal high heterosis and could result in segregates with higher grain yield, that is better recombinants will be gained. The shortest inter-cluster distance between cluster (III) and cluster (V), indicates the existence of closer proximity between these clusters as compared with other clusters. Hence, crossing between these two clusters could result poor genetic recombinant and is not advisable .
3.1.3. Cluster Mean Analysis
The cluster means for fourteen durum wheat trait presented in (Table 3). Genotypes in cluster (I) were characterized by the highest mean value of protein content, number of non-effective tiller per plant and by lowest mean value of number of spikelet per spike, number of kernel per spike, harvest index and grain yield. Days to maturity and thousand kernel weight characterizes cluster (I) by their second lowest mean value. Genotypes in cluster (II) were characterized by their highest mean values of days to maturity. Thousand kernel weights, number of non-effective tiller per plant and protein content characterize cluster two by their lowest mean value. Cluster (II), also characterized by the second lowest mean values of spikelet per spike, kernel per spike, harvest index and plant height.
Genotypes in cluster (III) were characterized by the highest mean of thousand kernel weight and by the second highest mean value of spike length and plant height. Days to heading by its lowest mean value characterized cluster (III). Genotypes in cluster (IV) were characterized by the highest mean value of grain filling period, spike length, number of kernel per spike, number of spikelet per spike, plant height, biomass yield, harvest index and grain yield. Cluster (IV) also characterized by the second largest mean value of days to maturity and number of effective tiller per plant while, protein content characterized cluster (IV) by its second lowest mean value. Genotypes in cluster (V) were characterized by the highest mean value of number of effective tiller per plant and by the second highest mean value of harvest index, protein content and grain yield. On the contrary by the second lowest mean value of biomass yield. Genotypes in this cluster may be used as best alternative for the simultaneous improvement of both grain yield and protein content.
Genotypes in cluster (VI) were characterized by their higher mean value of days to heading and lower mean value of number of effective tiller per plant, days to maturity, biomass yield and plant height and by second lowest mean of grain yield. The differences in clusters could entail their being originated from different sources while, the genotypes grouped together would indicate similarity among individuals in the same group. Crossing between the genotype of the same group may not offer good segregates. The crosses may be attempted between the genotypes of the group separated by large inter-cluster distance. The genotypes maintained under different groups had specific traits and it may give desirable genetic recombinants in developing high yielding varieties if they are used in hybridization. The present study revealed that ample variability existed in durum wheat genotypes tested under the environment and this offers many opportunities for genetic advancement through direct selection for future exploitation and hybridization program.
Table 1. The distribution of 45 durum wheat genotypes in to six distinct clusters based on D2 analysis.

No. of Clusters

No. of Genotypes

Name of Genotypes

1

5

CDSS09B00032S-099Y, ICD08-361-BLMSD, DW184085, CM17904-B-3M-1Y-1Y and ICD04-0433

2

9

CDSS09B00408D-5Y, 2015 offseason DW/F3 DZ #13, 2015 offseason DW/F3 DZ #18, 2015 offseason

DW/F3 DZ #20, 2015 offseason DW/F3 DZ #61, ICD04-0433, BV-17 PCDW 13099, ICD06-0208-BLMSD and DW184086

3

10

2015 offseason DW/F3 DZ #77, CD15DZ_ELT/off/1163/2015, ICD90-0179, ICD11-260-0TR,

DW184087, DW184055, BV-17 PCDW 10046, 2018 off se. CD-SRDZOS #639, 15/16 chefe Donsa LR and ICARDA Germplasm

4

8

ICD07-785-BLMSD, CD15DZ_ELT/off/1117/2015, ICD94-0994, ICD06-0965_BLMSD, MS115-

16C49IDYN, DW184047, DW183155 and ICD94-0994-C

5

9

BV-17 PCDW 11001, DW184089, DW183117, DW184062, 2018 off, ICD11-247-0TR-3STR, BV _ 17

PCDW 10320, Tesfaye (Check) and Utuba (check)

6

4

DW184100, DW183149, BV_17 PCDW10660 and BV-17 PCDW 10028

Table 2. Intra (bold diagonal) and inter Euclidean distance among 45 durum wheat genotypes tested at Injibara substation in 2020.

Cluster

I

II

III

IV

V

VI

I

248.56

474.86

1387.34

3082.87

1507.13

1660.59

II

283.98

1008.42

2659.77

1147.48

1746.49

III

440.93

2567.03

153.47

1582.50

IV

181.46

2652.70

4118.67

V

306.81

1541.55

VI

251.25

X2= 22.36 at 5% probability level
Table 3. Cluster means analysis of fourteen traits of 45 durum wheat genotypes tested at Injibara substation in 2020.

Cluster

DSH

DSM

GFP

SL

NNT

ETNP

TKW

SPS

KPS

PH

BY

HI

PC

GY

I

69.70

123.40

53.70

5.08

1.78

3.00

39.17

16.43

39.52

68.38

14654.81

0.21

13.06

3116.84

II

73.67

131.33

58.22

5.26

1.23

3.01

36.75

16.93

40.70

67.41

14719.05

0.24

12.30

3587.22

III

69.68

126.50

56.83

6.25

1.26

3.30

45.85

18.29

46.17

70.48

14115.61

0.31

12.71

4395.06

IV

69.88

130.69

60.81

6.41

1.48

3.97

44.42

21.17

58.95

71.15

16319.22

0.35

12.41

5711.70

V

72.89

126.33

53.44

5.08

1.66

4.40

42.47

18.41

47.43

67.68

13978.49

0.32

13.03

4463.67

VI

73.88

120.75

46.88

5.25

1.44

2.38

44.50

18.60

48.03

66.00

13001.48

0.25

12.43

3271.30

DSH=days to heading, DSM = days to maturity, GFP = grain filling period, SL= spike length, NNT= number of non-effective tiller per plant, ETNP = number effective tiller per plant, TKW= thousand kernel weight, SPS = number of spikelet per spike, KPS = number of kernel per spike, PH = plant height, BY= biomass yield, HI= harvest index, PC= protein content and GY= grain yield
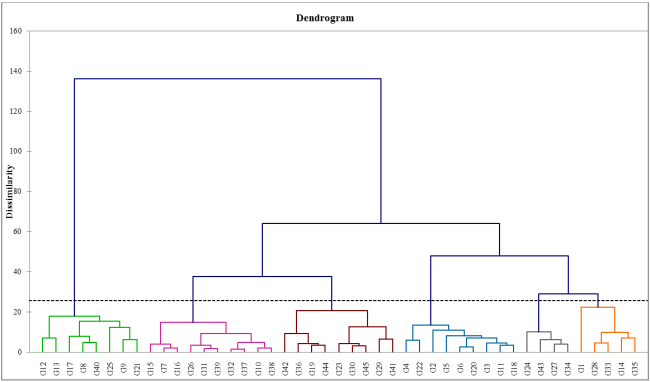
Figure 1. Dendrogram for forty five durum wheat genotypes tested at Injibara substation in 2020.
3.2. Principal Components Analysis
The results of principal component analysis for fourteen traits of forty five durum wheat genotypes are presented in (Table 4). The factors having Eigen value less than one were ignored. These were ignored due to Gutten’s lower bound principle that Eigen values less than one should be ignored Suggested standard criteria permit to ignore components whose variance explained are less than one when a correlation matrix is used. According to , characters with largest absolute values closer to unity with in the first principal component influence the clustering more than those with lower absolute values closer to zero.
The first five principal components (PCs) accounted (79.41%) of the total variation. The five PCAs were retained in analysis because each PCA had Eigen values greater than one and had more contribution to total variability. Accordingly, of the five principal components the first principal components (PCs) accounted (36.24%) of the variation and this was mainly due to the positive loading effect of number of spikelet per spike (0.85), number of kernel per spike (0.85), harvest index (0.83), days to maturity (0.59), grain filling period (0.65), spike length (0.54), biomass yield (0.53) and grain yield (0.95). The second principal component accounted (15.46%) of the variation and the major contributing traits were grain filling period (0.68), days to maturity (0.58) and biomass yield (0.40) with high and positive loading effect. Whereas, number of non-effective tiller per plant (-0.63), thousand kernels weight (-0.51), harvest index (-0.31), number of spikelet per spike (-0.30), number of kernel per spike (-0.31) and protein content (-0.33) had highest negative loading effect in PCA two.
In the third principal component, traits with high and positive component loading effects were spike length (0.66), plant height (0.45) and protein content (0.43). On the contrary number of effective tiller per plant (-0.55) and days to heading (-0.46) had high negative component loading effect for PCA three. In the fourth principal component, traits with high and positive component loading were number of non-effective tiller per plant (0.58) and protein content (0.57) while, thousand kernel weight (-0.51) had high negative loading effect. In the fifth principal component, traits with high and positive component loading were days to heading (0.78) and days to maturity (0.39) while, number of effective tiller per plant (-0.35) and biomass yield (-0.26) with negative loading effect. Similar results were reported by .
Table 4. Factor loadings, variance explained and Eigen values of fourteen traits and forty five durum wheat genotypes evaluated at Injibara substation in 2020.

Trait

PC1

PC2

PC3

PC4

PC5

DSH

-0.23

-0.25

-0.46

0.17

0.78

DSM

0.59

0.58

-0.15

0.18

0.39

GFP

0.65

0.68

0.11

0.07

-0.06

SL

0.54

-0.13

0.66

-0.09

0.17

NNT

-0.15

-0.63

-0.13

0.58

-0.10

ETNP

0.40

-0.20

-0.55

-0.09

-0.35

TKW

0.41

-0.51

0.20

-0.51

0.10

SPS

0.85

-0.30

-0.17

0.05

0.06

KPS

0.85

-0.31

-0.15

0.07

0.03

PH

0.52

0.10

0.45

0.33

0.20

BY

0.53

0.40

-0.30

0.3

-0.26

HI

0.83

-0.31

0.01

-0.13

0.00

PC

-0.14

-0.33

0.43

0.57

-0.17

GY

0.95

-0.11

-0.08

0.02

-0.08

Eigen value

5.07

2.16

1.57

1.24

1.07

Variability (%)

36.24

15.46

11.21

8.84

7.67

Cumulative%

36.24

51.70

62.91

71.74

79.41

DSH=days to heading, DSM = days to maturity, GFP = grain filling period, SL= spike length, NNT= number of non-effective tiller per plant, ETNP = number effective tiller per plant, TKW= thousand kernel weight, SPS = number of spikelet per spike, KPS = number of kernel per spike, PH = plant height, BY= biomass yield, HI= harvest index, PC= protein content and GY= grain yield
The two dimensional ordinations of forty five durum wheat and fourteen quantitative traits on biplot axes PC1 and PC2 (Figure 2) and biplot axes PC3 and PC4 (Figure 3), revealed scattered diagram of genotypes and quantitative traits distribution pattern on axes with cumulative variations (51.70%) and (20.05%) respectively. Durum wheat genotypes that were land in (QI) had especial or better character for grain filling period, days to maturity and biomass yield while, genotypes in (QIII) were characterized by their unique feature for protein content, days to heading and number of non-effective tiller per plant (Figure 2. PCA axis of 1 and 2). Higher grain yield, harvest index, number of kernel per spike and number of spikelet per spike were the better feature of genotypes in (QIV) (PCA axis of 1 and 2 Figure 2). Protein content and plant height were excellent character of genotypes that land in to QI (PCA axis of 3 and 4 Figure 3) while, number of non-effective tiller per plant, biomass yield and days to heading were the discriminating character of genotypes in (QII) (PCA axis of 3 and 4 Figure 3). Spike length and thousand kernel weights were the discriminating features of (QIV) (PCA axis of 3 and 4 Figure 3).
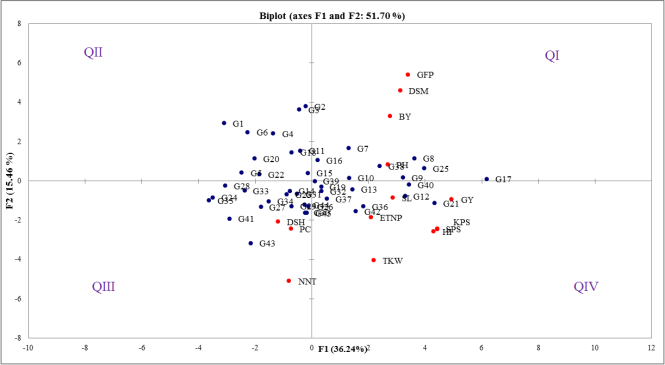
Figure 2. Scattered diagram of 45 durum wheat genotypes by fourteen traits using to dimensional ordination of traits on PCA 1 and 2.
DSH=days to heading, DSM = days to maturity, GFP = grain filling period, SL= spike length, NNT= number of non-effective tiller per plant, ETNP = number effective tiller per plant, TKW= thousand kernel weight, SPS = number of spikelet per spike, KPS = number of kernel per spike, PH = plant height, BY= biomass yield, HI= harvest index, PC= protein content and GY= grain yield
4. Conclusions
Durum wheat is a key cereal crop in Ethiopia, essential for the national economy and a staple food in marginal highlands. However, the availability of improved varieties remains a significant challenge, particularly in the Awi zone, where there is a lack of high-yielding options. The development of improved varieties began with the collection and preservation of genetic material, followed by genetic divergence analysis. Significant differences (P < 0.01) were found for all traits studied, with the first five principal components explaining 79.41% of the total variation. The durum wheat genotypes grouped into six clusters, each containing four to ten genotypes. Clusters IV and VI are recommended as parental materials for developing high-yielding varieties due to their potential for heterosis. Clusters I and V, noted for high protein content, should be prioritized for future quality pasta breeding. While significant differences among genotypes were observed, ongoing research is needed to confirm genotype stability and improve genetic gains. The national durum wheat program should focus on regions suitable for diverse genotypes and conduct further studies on those that exhibit promising traits.
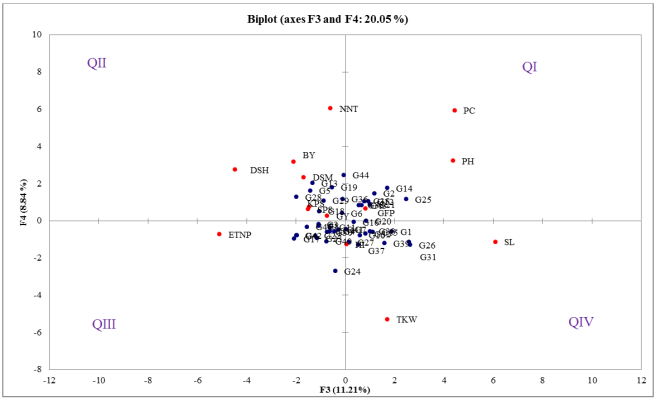
Figure 3. Scattered diagram by using two dimensional ordinations of 45 durum wheat genotypes and fourteen traits based on PCA 3 and 4.
DSH=days to heading, DSM = days to maturity, GFP = grain filling period, SL= spike length, NNT= number of non-effective tiller per plant, ETNP = number effective tiller per plant, TKW= thousand kernel weight, SPS = number of spikelet per spike, KPS = number of kernel per spike, PH = plant height, BY= biomass yield, HI= harvest index, PC= protein content and GY= grain yield
Abbreviations

PCA

Principal Component Analysis

DAP

Diammonium Phosphate

PC

Principal Component

NPS

Nitrogen, Phosphorus, and Sulfur fertilizers

DSH

Days to Heading

DSM

Days to Maturity

GFP

Grain Filling Period

SL

Spike Length

NNT

Number of Non-effective Tiller per Plant

ETNP

Number Effective Tiller per Plant

TKW

Thousand Kernel Weight

SPS

Number of Spikelet per Spike

KPS

Number of Kernel per Spike

PH

Plant Height

BY

Biomass Yield

HI

Harvest Index

PC

Protein Content

GY

Grain Yield

Acknowledgments
The authors express their gratitude to the Ethiopian Institute of Agricultural Research and the Pawe Agricultural Research Center for their collaboration throughout the experimental process. Special thanks are also extended to Mr. Mekuria Temtime, the National Durum Wheat Research Project coordinator, for his invaluable and unwavering support in providing materials and facilities during the research work.
Author Contributions
Birkneh Kuru is the sole author. The author read and approved the final manuscript.
Ethics Approval
Not applicable.
Conflicts of Interest
The author declares no conflicts of interest.
References
[1] Adilova, S. S., Qulmamatova, D. E., Baboev, S. K., Bozorov, T. A., & Morgunov, A. I. (2020). Multivariate cluster and principle component analyses of selected yield traits in uzbek bread wheat cultivars. American Journal of Plant Sciences, 11(06), 903.
[2] Afrooz, G., Sabaghnia, N., Karimizadeh, R., & Shekari, F. (2014). Analysis of some agronomic traits of durum wheat under dryland and supplemental irrigation conditions. Agriculture (Pol’nohospodárstvo), 60(4), 149–158.
[3] Ahmad, H. M., Awan, S. I., Aziz, O., & Ali, M. A. (2014). Multivariative analysis of some metric traits in bread wheat (Triticum aestivum L.). Eur. J. Biotechnol. Biosci, 1(4), 22–26.
[4] Alam, M. A., Khan, A. A., Alam, M. K., Sarker, Z. I., & Rahman, M. M. (2013). Variability and diversity studies in durum wheat (Triticum durum). Journal of Science and Technology, 11, 1–5.
[5] Allard, R. W. (1999). Principles of Plant Breeding. John Wiley & Sons.
[6] Arora, A., Kundu, S., Dilbaghi, N., Sharma, I., & Tiwari, R. (2014). Population structure and genetic diversity among Indian wheat varieties using microsatellite (SSR) markers. Australian Journal of Crop Science, 8(9).
[7] Bhanupriya, B., Satyanarayana, N., Mukherjee, S., & Sarkar, K. (2014). Genetic diversity of wheat genotypes based on principal component analysis in Gangetic alluvial soil of West Bengal. Journal of Crop and Weed, 10(2), 104–107.
[8] Brown‐Guedira, G. L., Thompson, J. A., Nelson, R. L., & Warburton, M. L. (2000). Evaluation of genetic diversity of soybean introductions and North American ancestors using RAPD and SSR markers. Crop Science, 40(3), 815–823.
[9] Ceoloni, C., & Jauhar, P. P. (2006). Chromosome engineering of the durum wheat genome: strategies and applications of potential breeding value. Genetic Resources, Chromosome Engineering, and Crop Improvement, 2, 27–59.
[10] Chahal, G. S., & Gosal, S. S. (2002). Principles and procedures of plant breeding: biotechnological and conventional approaches. Alpha Science Int’l Ltd.
[11] Devesh, P., Moitra, P. K., Shukla, R. S., & Pandey, S. (2019). Genetic diversity and principal component analyses for yield, yield components and quality traits of advanced lines of wheat. Journal of Pharmacognosy and Phytochemistry, 8(3), 4834–4839.
[12] Gashaw, A., Mohammed, H., & Singh, H. (2007). Genetic divergence in selected durum wheat genotypes of Ethiopian plasm. African Crop Science Journal, 15(2).
[13] Getachew, A., Alamerew, S., & Worede, F. (2017). Multivariate analysis of phenotypic diversity of bread wheat (Triticum aestivum L) in the highlands of northern Ethiopia. Adv. Crop Sci Tech, 5(5), 1–7.
[14] Ghaderi, A., Adams, M. W., & Nassib, A. M. (1984). Relationship between genetic distance and heterosis for yield and morphological traits in dry edible bean and faba bean 1. Crop Science, 24(1), 37–42.
[15] Hoque, M. N., & Lutfur Rahman, L. R. (2007). Estimation of Euclidean distance for different morpho-physiological characters in some wild and cultivated rice genotypes (Oryza sativa L.).
[16] Jolliffe, I. T., & Cadima, J. (2016). Principal component analysis: a review and recent developments. Philosophical Transactions of the Royal Society A: Mathematical, Physical and Engineering Sciences, 374(2065), 20150202.
[17] Khodadadi, M., Fotokian, M. H., & Miransari, M. (2011). Genetic diversity of wheat (Triticum aestivum L.) genotypes based on cluster and principal component analyses for breeding strategies. Australian Journal of Crop Science, 5(1), 17–24.
[18] Kumar, R., Vashisht, P., Gupta, R. K., Singh, M., & Kaushal, S. (2010). Characterization of European carrot genotypes through principal components and regression analyses. International Journal of Vegetable Science, 17(1), 3–12.
[19] Kumar, V., Payasi, D. K., & Saiprasad, S. V. (2014). Genetic Divergence Analysis in Durum Wheat (Triticum durum L. Desf.) Int. J. Curr. Res, 6(6), 7001–7005.
[20] Liu, F., Sun, G.-L., Salomon, B., & von Bothmer, R. (2001). Distribution of allozymic alleles and genetic diversity in the American Barley Core Collection. Theoretical and Applied Genetics, 102, 606–615.
[21] Mangova, M., & Petrova, I. (2007). Detection of quality diversity of durum wheat (Triticum durum Desf.) using cluster and principal component analyses. Bulg J Agric Sci, 13, 301–308.
[22] Mengistu, D. K., Kidane, Y. G., Fadda, C., & Pè, M. E. (2018). Genetic diversity in Ethiopian durum wheat (Triticum turgidum var durum) inferred from phenotypic variations. Plant Genetic Resources, 16(1), 39–49.
[23] Mohammadi, S. A., & Prasanna, B. M. (2003). Analysis of genetic diversity in crop plants—salient statistical tools and considerations. Crop Science, 43(4), 1235–1248.
[24] Muez. M, Solmon. F, Haddis. Y, & Adhiena. M. (2015). Genetic divergence study of durum wheat (Triticum durum Desf) genotypes grown in Tigray, Ethiopia.
[25] Nefzaoui, M., Udupa, S. M., Gharbi, M. S., Bouhadida, M., & Iraqi, D. (2014). Molecular diversity in Tunisian durum wheat accessions based on microsatellite markers analysis.
[26] Negisho, K., Shibru, S., Pillen, K., Ordon, F., & Wehner, G. (2021). Genetic diversity of Ethiopian durum wheat landraces. Plos One, 16(2), e 0247016.
[27] Siahbidi, M. M. P., Aboughadareh, A. P., Tahmasebi, G. R., Teymoori, M., & Jasemi, M. (2013). Evaluation of genetic diversity and interrelationships of agro-morphological characters in durum wheat (Triticum durum Desf.) lines using multivariate analysis. International Journal of Agriculture, 3(1), 184.
[28] Singh, R. K., & Chaudhary, B. D. (1981). Biometrical methods in quantitative genetic analysis.
[29] Soleymanifard, A., Naseri, R., & Meysam, M. (2012). The study genetic variation and factor analysis for agronomic traits of Durum wheat genotypes using cluster analysis and path analysis under drought stress condition in western of Iran. Int. Res. J. Appl. Basic Sci, 3(3), 479–485.
[30] Ward Jr, J. H. (1963). Hierarchical grouping to optimize an objective function. Journal of the American Statistical Association, 58(301), 236–244.
[31] XLSTAT, 2014. XLSTAT User’s Guide, XLSTAT Pearson Edition, Version 2014.5.03, Paris, FRANCE, October 2014.
[32] Zamanianfard, Z., Etminan, A., Mohammadi, R., & Shooshtari, L. (2015). Evaluation of molecular diversity of durum wheat genotypes using ISSR markers.
[33] Zemede, A., Mekbib, F., Assefa, K., & Bishaw, Z. (2019). Variability in Ethiopian durum wheat under rainfed environment subjected to drought at anthesis. Ethiopian Journal of Agricultural Sciences, 29(2), 17–29.
Cite This Article
  • APA Style

    Kuru, B. (2025). Genetic Diversity Studies in Durum Wheat (Triticum turgidum L. var. durum) Advanced Lines Based on Cluster and Principal Component Analysis Using Agronomic Traits in Northwestern Ethiopia. International Journal of Photochemistry and Photobiology, 7(1), 19-28. https://doi.org/10.11648/j.ijpp.20250701.13

    Copy | Download

    ACS Style

    Kuru, B. Genetic Diversity Studies in Durum Wheat (Triticum turgidum L. var. durum) Advanced Lines Based on Cluster and Principal Component Analysis Using Agronomic Traits in Northwestern Ethiopia. Int. J. Photochem. Photobiol. 2025, 7(1), 19-28. doi: 10.11648/j.ijpp.20250701.13

    Copy | Download

    AMA Style

    Kuru B. Genetic Diversity Studies in Durum Wheat (Triticum turgidum L. var. durum) Advanced Lines Based on Cluster and Principal Component Analysis Using Agronomic Traits in Northwestern Ethiopia. Int J Photochem Photobiol. 2025;7(1):19-28. doi: 10.11648/j.ijpp.20250701.13

    Copy | Download

  • @article{10.11648/j.ijpp.20250701.13,
      author = {Birkneh Kuru},
      title = {Genetic Diversity Studies in Durum Wheat (Triticum turgidum L. var. durum) Advanced Lines Based on Cluster and Principal Component Analysis Using Agronomic Traits in Northwestern Ethiopia
    },
      journal = {International Journal of Photochemistry and Photobiology},
      volume = {7},
      number = {1},
      pages = {19-28},
      doi = {10.11648/j.ijpp.20250701.13},
      url = {https://doi.org/10.11648/j.ijpp.20250701.13},
      eprint = {https://article.sciencepublishinggroup.com/pdf/10.11648.j.ijpp.20250701.13},
      abstract = {Durum wheat (Triticum turgidum L. var. durum) production and productivity in Ethiopia is low as compared to the world average productivity because of limited breeding and pre breeding interventions. Cluster analysis and principal component analysis are valuable tools for identifying and improving plant traits in durum wheat genotypes. This study, conducted at the Ethiopian Institute of Agricultural Research's Pawe Agricultural Research Center, Injibara substation, aimed to assess the clustering patterns of durum wheat genotypes and pinpoint key traits that differentiate these genotypes. A total of 45 durum wheat genotypes were examined using a 5x9 alpha lattice design during the 2020/2021 cropping season. Results from the analysis of variance underscored significant variations (P ≤ 0.01) among genotypes for all traits studied. Cluster analysis revealed the classification of the 45 durum wheat genotypes into six distinct clusters. Genotypes in Cluster IV exhibit significant genetic diversity, making them valuable candidates for direct integration into hybridization programs aimed at cultivating high-yielding durum wheat varieties. On the other hand, genotypes in cluster I showcase distinct genetic variations in protein content, suggesting their potential use in augmenting protein and gluten levels as well as other favorable attributes beyond grain yield in breeding initiatives, while Principal Component Analysis (PCA) identified five principal components with Eigen values above one, jointly elucidating 79.41% of the total variation. The findings suggest promising prospects for enhancing yield and desirable characteristics through selective breeding. Nonetheless, given the study's single-season scope, further evaluations across diverse locations and over multiple cropping seasons are imperative to validate and build upon these initial insights.
    },
     year = {2025}
    }
    

    Copy | Download

  • TY  - JOUR
    T1  - Genetic Diversity Studies in Durum Wheat (Triticum turgidum L. var. durum) Advanced Lines Based on Cluster and Principal Component Analysis Using Agronomic Traits in Northwestern Ethiopia
    
    AU  - Birkneh Kuru
    Y1  - 2025/06/20
    PY  - 2025
    N1  - https://doi.org/10.11648/j.ijpp.20250701.13
    DO  - 10.11648/j.ijpp.20250701.13
    T2  - International Journal of Photochemistry and Photobiology
    JF  - International Journal of Photochemistry and Photobiology
    JO  - International Journal of Photochemistry and Photobiology
    SP  - 19
    EP  - 28
    PB  - Science Publishing Group
    SN  - 2640-429X
    UR  - https://doi.org/10.11648/j.ijpp.20250701.13
    AB  - Durum wheat (Triticum turgidum L. var. durum) production and productivity in Ethiopia is low as compared to the world average productivity because of limited breeding and pre breeding interventions. Cluster analysis and principal component analysis are valuable tools for identifying and improving plant traits in durum wheat genotypes. This study, conducted at the Ethiopian Institute of Agricultural Research's Pawe Agricultural Research Center, Injibara substation, aimed to assess the clustering patterns of durum wheat genotypes and pinpoint key traits that differentiate these genotypes. A total of 45 durum wheat genotypes were examined using a 5x9 alpha lattice design during the 2020/2021 cropping season. Results from the analysis of variance underscored significant variations (P ≤ 0.01) among genotypes for all traits studied. Cluster analysis revealed the classification of the 45 durum wheat genotypes into six distinct clusters. Genotypes in Cluster IV exhibit significant genetic diversity, making them valuable candidates for direct integration into hybridization programs aimed at cultivating high-yielding durum wheat varieties. On the other hand, genotypes in cluster I showcase distinct genetic variations in protein content, suggesting their potential use in augmenting protein and gluten levels as well as other favorable attributes beyond grain yield in breeding initiatives, while Principal Component Analysis (PCA) identified five principal components with Eigen values above one, jointly elucidating 79.41% of the total variation. The findings suggest promising prospects for enhancing yield and desirable characteristics through selective breeding. Nonetheless, given the study's single-season scope, further evaluations across diverse locations and over multiple cropping seasons are imperative to validate and build upon these initial insights.
    
    VL  - 7
    IS  - 1
    ER  - 

    Copy | Download

Author Information